Who this is for: Admin and Staff users
Goal: Understand every section of the Task Session dashboard — what each metric means, how to use the navigation to move through the platform efficiently, and how the dashboard differs depending on your user role.
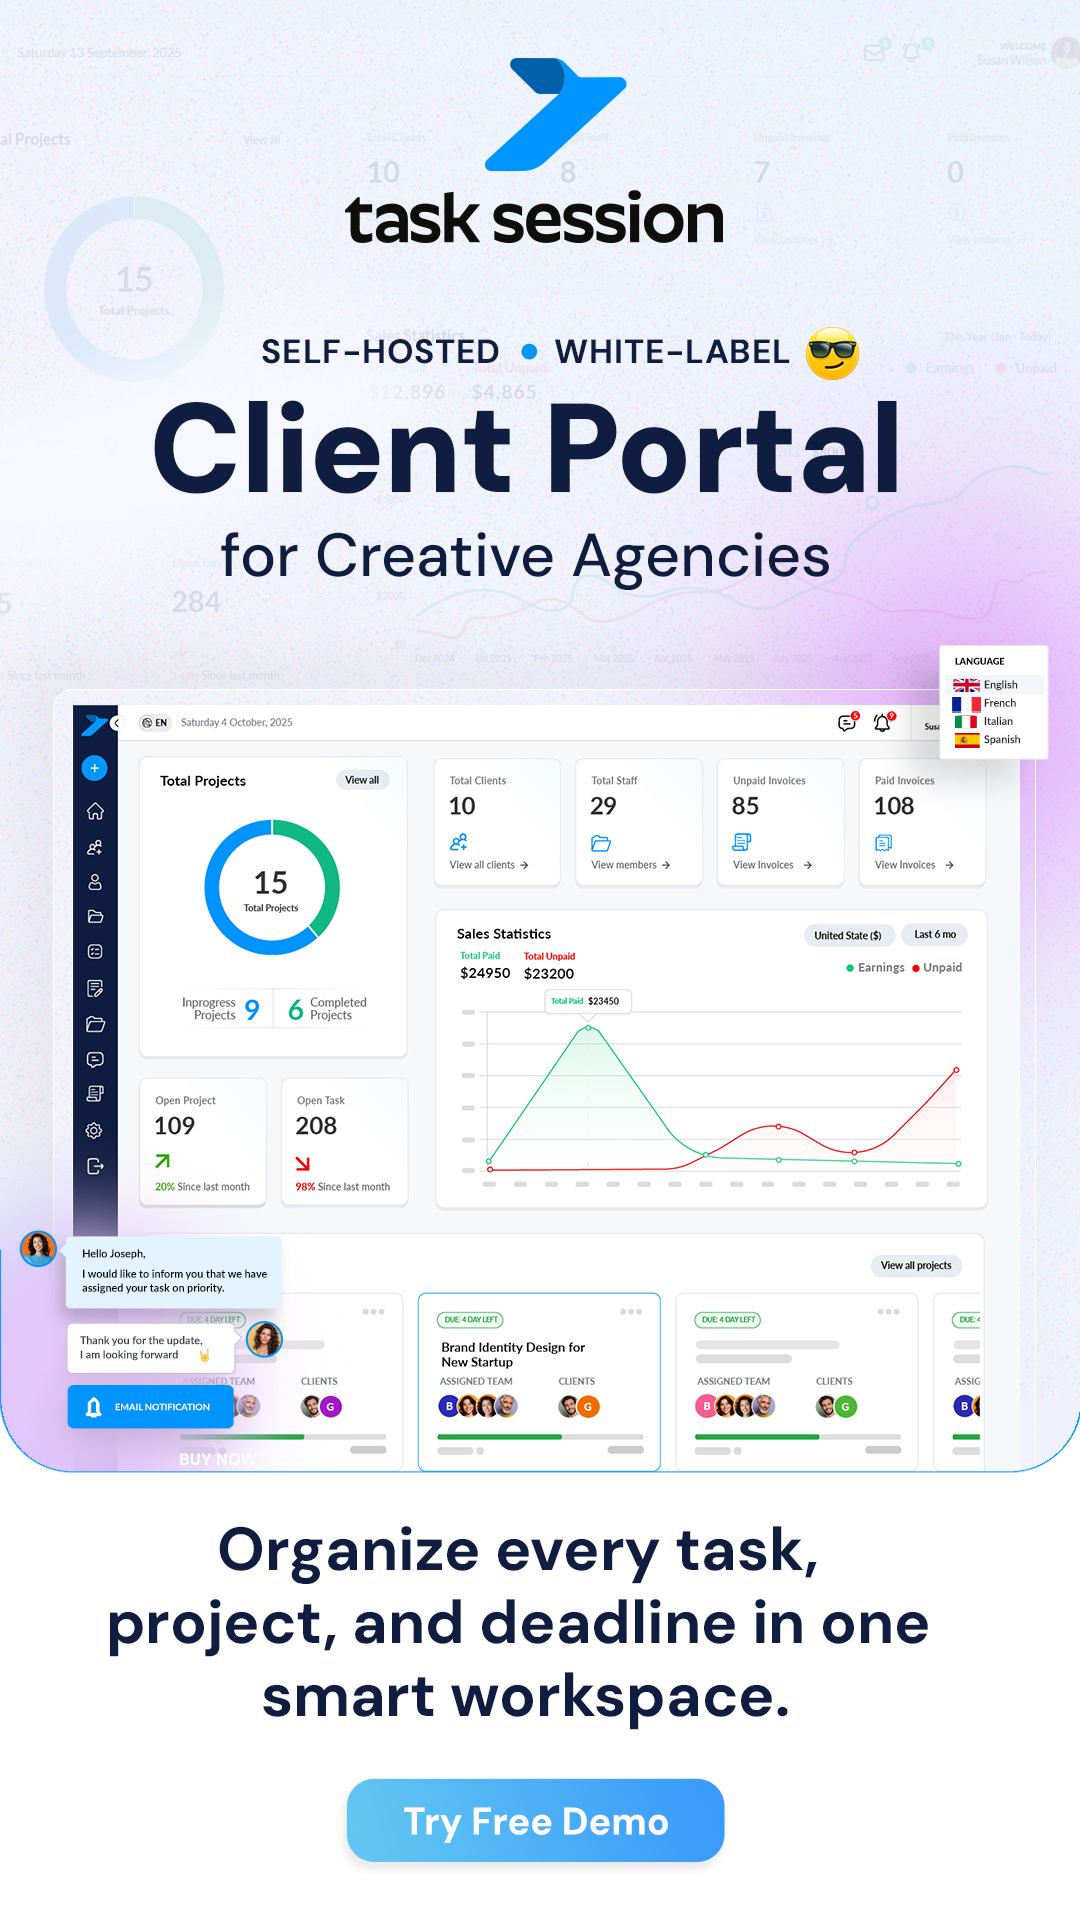
The dashboard is the first screen you see every time you log in. It is designed to give you a complete snapshot of your business at a glance — active projects, pending tasks, outstanding invoices, team activity, and client engagement — all in one place without clicking into individual sections.
What the Dashboard Shows
The admin dashboard is organised into distinct sections, each presenting a different aspect of your operations. The exact layout and available sections depend on your role — admins see the full picture, while staff and clients see a filtered view relevant to their access level.
Here is what each section of the admin dashboard displays and why it matters.
Project Overview
The project overview section gives you a high-level count of your projects broken down by status. Depending on your version, you may see the following categories:
- Total Projects: The total number of projects in the system, regardless of status. This is your overall volume indicator.
- Active Projects: Projects currently in progress. These are the projects your team and clients are actively working on.
- Completed Projects: Projects marked as finished. A high count here relative to active projects shows healthy throughput.
- On Hold / Paused: Projects that have been temporarily stopped. If this number creeps up, it may indicate bottlenecks, client delays, or resource issues.
- Overdue Projects: Projects that have passed their deadline without being completed. This is one of the most important numbers to monitor — overdue projects affect client satisfaction and your team’s credibility.
How to use this section: Check it at the start of each day or week. If active projects are climbing but completed projects are flat, your team may be taking on more work than it can finish. If overdue projects are increasing, investigate which ones are stuck and why.
Clicking on any project count typically takes you to a filtered view of that category inside the Projects section, where you can drill into specific projects.
Task Summary
The task summary section shows how work is distributed across your Kanban pipeline:
- Total Tasks: The overall number of tasks across all projects.
- Tasks by Status: A breakdown by Kanban column — how many tasks are in To Do, In Progress, Review, Done, and any custom columns you have created.
- Overdue Tasks: Tasks that have passed their due date. Like overdue projects, this number demands attention. Overdue tasks are the leading indicator of projects falling behind.
- Tasks Assigned to You: Your personal workload count (visible to all roles).
- Unassigned Tasks: Tasks that exist but have not been assigned to anyone. These are orphaned work items that will not get done unless someone takes ownership.
How to use this section: The ratio of “In Progress” to “To Do” tells you whether your team is actively working through the backlog or if work is piling up. A growing number of unassigned tasks is a signal to review your project plans and distribute work. Overdue tasks should be addressed daily.
Invoice and Payment Metrics
This section gives you a financial overview of your invoicing pipeline. It is visible only to admins and users with financial access permissions.
- Total Invoiced: The total value of all invoices created in the system (or within a selected period). This represents your gross billing.
- Total Paid: The total value of payments received. This is your collected revenue.
- Total Outstanding: The total value of invoices that have been sent but not yet paid. This is your accounts receivable.
- Overdue Invoices: Invoices that have passed their due date without payment. This is critical — overdue invoices directly impact your cash flow.
- Invoice Status Breakdown: A count of invoices by status — draft, sent, viewed, paid, overdue. “Viewed” is particularly useful because it tells you the client has seen the invoice but has not yet paid.
How to use this section: Monitor the gap between “Total Invoiced” and “Total Paid” — this is your outstanding receivable. If “Overdue Invoices” is growing, review your payment terms and consider enabling automated payment reminders. The “Viewed but not paid” status is a signal to follow up directly with the client.
Revenue and Receivables
Some dashboard versions include a revenue summary or chart that shows financial trends over time. This may appear as a bar chart, line chart, or summary cards depending on your Task Session version.
- Revenue this month: Total payments received in the current calendar month.
- Revenue trend: A comparison of revenue across recent months, helping you spot growth or decline.
- Receivables aging: How long outstanding invoices have been unpaid — grouped by 30, 60, and 90+ days.
How to use this section: Use the monthly revenue figure to track your business performance against targets. If receivables are aging past 30 days consistently, it may be time to tighten payment terms, enable automated reminders, or follow up with specific clients.
Team Activity
The team activity section shows what your staff members have been doing across the platform. This gives admins visibility into team engagement without micromanaging.
- Recent activity feed: A chronological list of recent actions — tasks created, tasks completed, files uploaded, comments posted, invoices sent.
- Active staff members: Which team members are currently online or have been active recently.
- Task completion rates: How many tasks each staff member has completed in a given period.
How to use this section: The activity feed is useful for staying informed without interrupting your team to ask for updates. If a staff member has no recent activity on their assigned tasks, it may warrant a check-in. Task completion rates help you understand capacity and distribute work more evenly.
Client Activity
The client activity section tracks how your clients are engaging with the portal. This is one of the most underused dashboard features, but it provides valuable business intelligence.
- Recent client logins: Which clients have logged into the portal and when. A client who never logs in is a client who is not engaged with your work.
- Client actions: What clients have done — viewed a project, downloaded a file, viewed an invoice, approved a task, left a comment.
- Invoice views: Which clients have opened their invoice link. This is useful for knowing when to follow up about payment — they have seen it, they just have not paid yet.
How to use this section: Active client engagement is a positive sign for retention. Clients who regularly log in, view progress, and respond to tasks are satisfied clients. Clients who have not logged in for weeks may need a proactive check-in from your side. Invoice views without payment are a prompt to follow up.
Main Navigation Structure
Task Session’s navigation is organised around the core functions of project management, client collaboration, and billing. Here is what each section contains and when you would use it.
Dashboard
Your home screen. The overview of everything happening across your instance. Return here whenever you need a quick status check without drilling into specific projects or sections.
Projects
The central hub for all project work. From here you can create new projects, view active and completed projects, access project details, and manage assignments. Each project contains its own tasks, files, discussions, milestones, and related invoices. Use the Projects section when you need to create, edit, or review project-level information.
Tasks
The Kanban board view of your task pipeline. This section can show tasks across all projects or filtered to a specific project. Use it for day-to-day task management — creating tasks, assigning them, setting priorities, dragging them between columns, and reviewing overdue items. Staff members will spend most of their time here.
Clients
Manage all client records. From here you can onboard new clients, view client details, track their portal activity, manage their permissions, and resend login invitations. Use the Clients section when you need to add or manage client accounts, review client engagement, or adjust what a specific client can access.
Invoicing
Create, send, and track invoices. View all invoices by status (draft, sent, viewed, paid, overdue), manage recurring invoices, configure payment reminders, and review payment history. Use the Invoicing section for all financial operations — creating new invoices, checking payment status, and managing your billing pipeline.
Files
Manage project files and media. Upload files, create folder structures, share documents with clients, and monitor storage usage. The media management dashboard provides cleanup tools for removing old or unused files. Use the Files section when you need to upload deliverables, organise project documents, or manage storage.
Chat
Real-time messaging. Includes project-based discussions, task-level chat, team channels, and 1:1 messaging. Supports file sharing in chat, mentions, replies, and searchable history. Use the Chat section for quick communication that does not need to live inside a task or project discussion.
Notes
Internal documentation. Create meeting notes, SOPs, project briefs, or any text content with rich text editing. Notes can be private, shared with specific users, or attached to projects and clients. Use Notes for information that needs to be recorded but does not belong inside a task or project discussion.
Settings
System configuration. This is where admins manage everything that controls how the platform works: general settings (timezone, currency, language), branding (logos, colours, themes), user management (roles, permissions), email (SMTP configuration), payment gateways (Stripe, PayPal, 2Checkout), integrations (Google Login, Google Drive), and security (password policies, login limits, session timeouts). Staff and clients do not have access to Settings.
Dashboard by User Role
Not every user sees the same dashboard. Task Session adjusts the dashboard view based on the logged-in user’s role.
Admin Dashboard
Admins see the complete picture — all projects, all tasks, all users, all financial data, all activity. The admin dashboard includes:
- Full project overview (all projects across all clients).
- Complete task summary (all tasks across all projects).
- Invoice and payment metrics (total invoiced, paid, outstanding, overdue).
- Revenue and receivables data.
- Team activity feed (all staff actions).
- Client activity tracking (login history, portal engagement).
- Access to all navigation sections including Settings.
The admin dashboard is designed for business owners and operations managers who need to monitor the health of the entire operation.
Staff Dashboard
Staff members see a dashboard scoped to their assignments. They will see:
- Projects they are assigned to (not all projects in the system).
- Tasks assigned to them (with due dates, priorities, and status).
- Their personal task completion metrics.
- Activity on projects they are involved in.
- Chat and discussion notifications relevant to them.
Staff members do not see financial data (invoices, payments, revenue), other staff members’ tasks, client management tools, or Settings — unless their role has been customised to include those permissions.
The staff dashboard is designed for people who need to focus on their own work without being distracted by the broader business context.
Client Dashboard (Portal View)
Clients log in to a completely separate portal experience. Their dashboard shows:
- Projects they have been assigned to (with progress indicators).
- Tasks that are marked as client-visible (internal-only tasks are hidden).
- Files shared with them through the portal.
- Invoices and payment status (their own invoices only).
- Chat and discussion threads they are part of.
- Notifications for updates, new tasks, and new invoices.
Clients cannot see other clients, internal team conversations, admin settings, or any content not explicitly shared with them. The portal is fully branded with your logo and colours if you have configured white-labelling.
Reading the Dashboard Effectively
The dashboard is most useful when you know what to look for. Here are the patterns that matter:
Daily Check (2 Minutes)
Open the dashboard each morning and review:
- Overdue tasks: Are there any? If so, which projects are they in and who is responsible?
- Overdue invoices: Any invoices past due? Follow up today.
- Team activity: Is your team actively working? Any staff members with no recent activity on assigned tasks?
This daily glance takes less than two minutes and catches problems early before they become serious.
Weekly Review (10 Minutes)
Once a week, go deeper:
- Project status distribution: Are more projects being created than completed? Is the backlog growing?
- Task pipeline balance: Are tasks flowing through the Kanban columns or getting stuck in one stage?
- Financial health: What is your outstanding receivable? Is it growing or shrinking? How much revenue came in this week?
- Client engagement: Are your key clients logging into the portal? Are they viewing invoices but not paying?
- Unassigned tasks: Are there tasks that no one is working on?
Monthly Review (30 Minutes)
At the end of each month, use the dashboard as a starting point for a more thorough review:
- Completed vs created projects: Is your team delivering at a sustainable rate?
- Revenue vs outstanding: What percentage of your billing has been collected? Is receivables aging improving or worsening?
- Team utilisation: Are workloads balanced across staff members, or is one person handling a disproportionate share?
- Client retention signals: Which clients are actively engaged? Which ones have gone quiet?
Navigating Efficiently
As your Task Session instance grows with more projects, clients, and team members, efficient navigation becomes important. Here are the key patterns for moving through the platform quickly.
- Dashboard as home base: Click the dashboard link or your logo to return to the overview at any time. Use it as your orientation point when you lose context.
- Click-through from metrics: Most dashboard numbers are clickable. Clicking “Overdue Tasks” takes you directly to a filtered list of overdue items. Clicking “Active Projects” shows only active projects. Use these shortcuts instead of manually navigating and filtering.
- Project as a container: Once inside a project, you have access to its tasks, files, discussions, and invoices without leaving the project context. Navigate within the project rather than jumping between top-level sections.
- Notifications: Task Session sends notifications for new tasks, comments, file uploads, and invoice events. Use the notification area (usually in the top navigation bar) to jump directly to new activity without searching for it.
- Search: Use the search function to find specific projects, tasks, clients, or invoices by name or keyword. This is faster than scrolling through lists as your data grows.
- Filters: In the Projects, Tasks, and Invoicing sections, use filters to narrow your view by status, assignee, client, date range, or priority. Filters are especially useful when you have dozens or hundreds of items.
Dashboard Metrics That Signal Problems
Certain dashboard patterns are early warning signs. Here is what to watch for and what each pattern typically means:
| Pattern | What It Signals | Recommended Action |
|---|---|---|
| Overdue tasks climbing week over week | Team is overloaded, deadlines are unrealistic, or tasks are blocked | Review overdue tasks individually. Reassign, extend deadlines, or remove blockers. |
| Overdue invoices growing | Clients are not paying on time. Cash flow risk. | Enable automated payment reminders. Follow up personally on high-value invoices. |
| “Viewed” invoices not converting to “Paid” | Client has seen the invoice but is delaying payment | Send a follow-up message. Review payment terms. Offer convenient payment methods. |
| Active projects growing but completions flat | Taking on more work than the team can deliver | Pause new onboarding until active projects are under control. Review capacity. |
| Unassigned tasks increasing | Work is being created but not distributed | Review project plans and assign owners. Consider if tasks are necessary. |
| Client login activity dropping | Client is disengaged or dissatisfied | Proactively reach out. Send a project update. Schedule a check-in. |
| Staff activity gaps | Team member may be blocked, overwhelmed, or disengaged | Check in privately. Review their task assignments and priorities. |
Customising Your Dashboard Experience
While the dashboard layout is set by Task Session’s design, there are several ways to tailor the experience to your workflow:
- Bookmark your starting point: If you spend most of your time in Tasks or Projects rather than the Dashboard overview, bookmark that section’s URL directly. Some users prefer to start their day on the Kanban board rather than the summary view.
- Use custom roles to control visibility: If certain staff members should not see financial metrics or client activity, create custom roles with appropriate permissions. The dashboard automatically adjusts to show only what the user is allowed to see.
- Set your timezone correctly: All dashboard timestamps, due dates, and activity feeds follow your system timezone. If these look wrong, check Settings and confirm the timezone is correct.
- Browser notifications: Enable browser notifications for real-time alerts about new tasks, chat messages, and invoice events — so you do not have to constantly check the dashboard for updates.
Common Questions About the Dashboard
Why do I see different numbers than my staff member?
Admins see data for all projects, tasks, and users. Staff members only see data for projects and tasks assigned to them. The numbers are role-scoped, not global. If you want a staff member to see more data, adjust their role permissions or assign them to additional projects.
Why are my overdue task numbers higher than expected?
Overdue tasks include any task past its due date that has not been marked as complete, across all projects. This includes tasks in projects that may have been paused or deprioritised but were never formally closed. Review old projects and clean up tasks that are no longer relevant.
Can I export dashboard data?
Depending on your Task Session version, you may be able to export invoicing data and project summaries from their respective sections. The dashboard itself is a real-time overview — for historical reporting, use the export features within the Invoicing and Projects sections.
Do clients see any financial metrics?
Clients see only their own invoices and payment history. They do not see your total revenue, other clients’ invoices, or any aggregated financial data. The client portal is fully isolated per client.
The dashboard loads slowly — what should I do?
If the dashboard is slow, the most common causes are limited server resources (upgrade from shared hosting to a VPS if needed), a large number of records without database optimisation, or browser cache issues. For VPS users, enabling PHP OPcache and tuning MySQL (as described in the VPS installation guide) can significantly improve dashboard load times.